User-friendly justice requires clear communication
I’ve been working at HiiL (short for The Hague Institute for Innovation of Law) since 2015. The biggest transformation – from a communications point of view – came in 2018, when we defined our goal as user-friendly justice: justice that is accessible, affordable and easy to use. We believe our reports should reflect the same values.
On this page, I will describe two trend reports designed by me: “Elephant in the Courtroom” and “Charging for Justice”.
#1
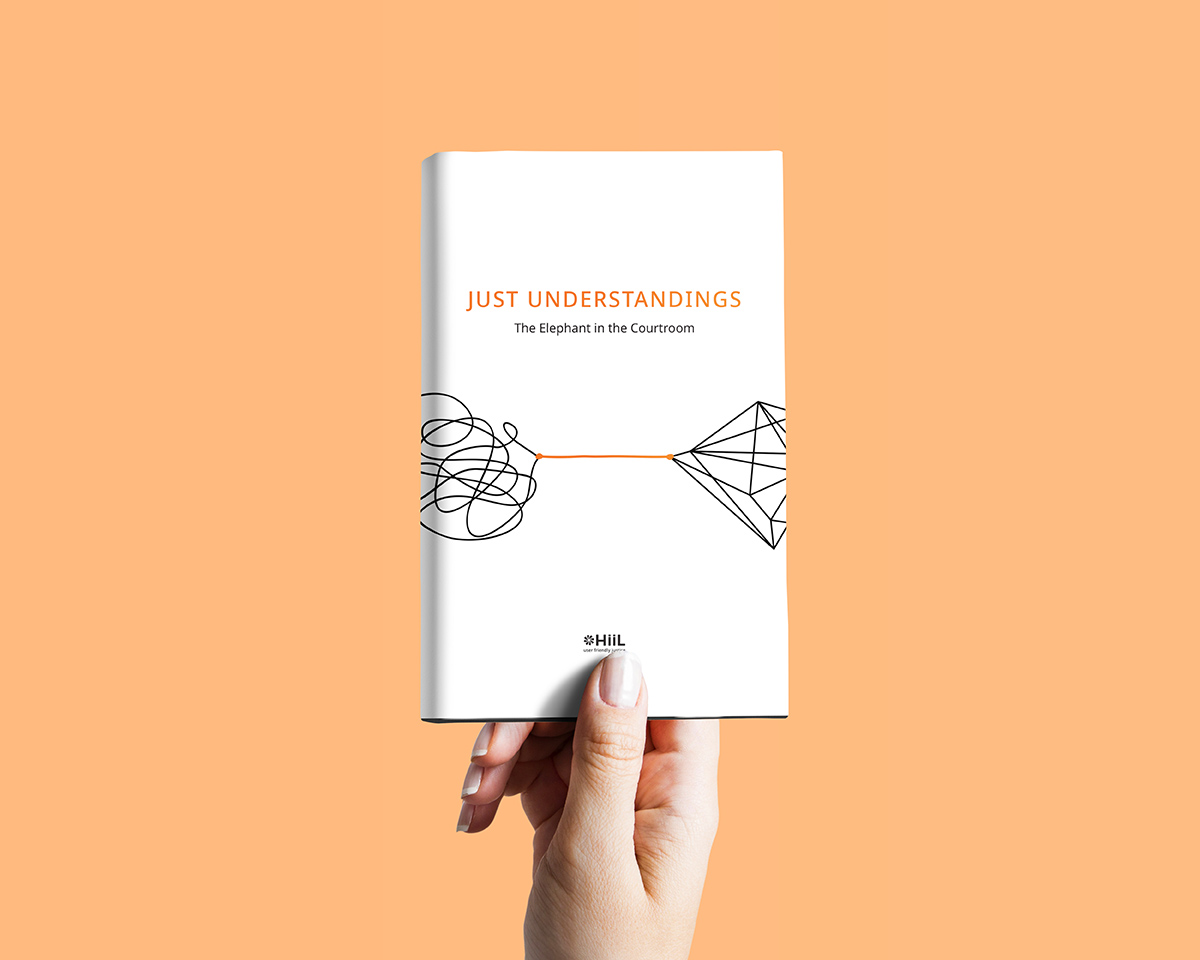
Elephant in the Courtroom
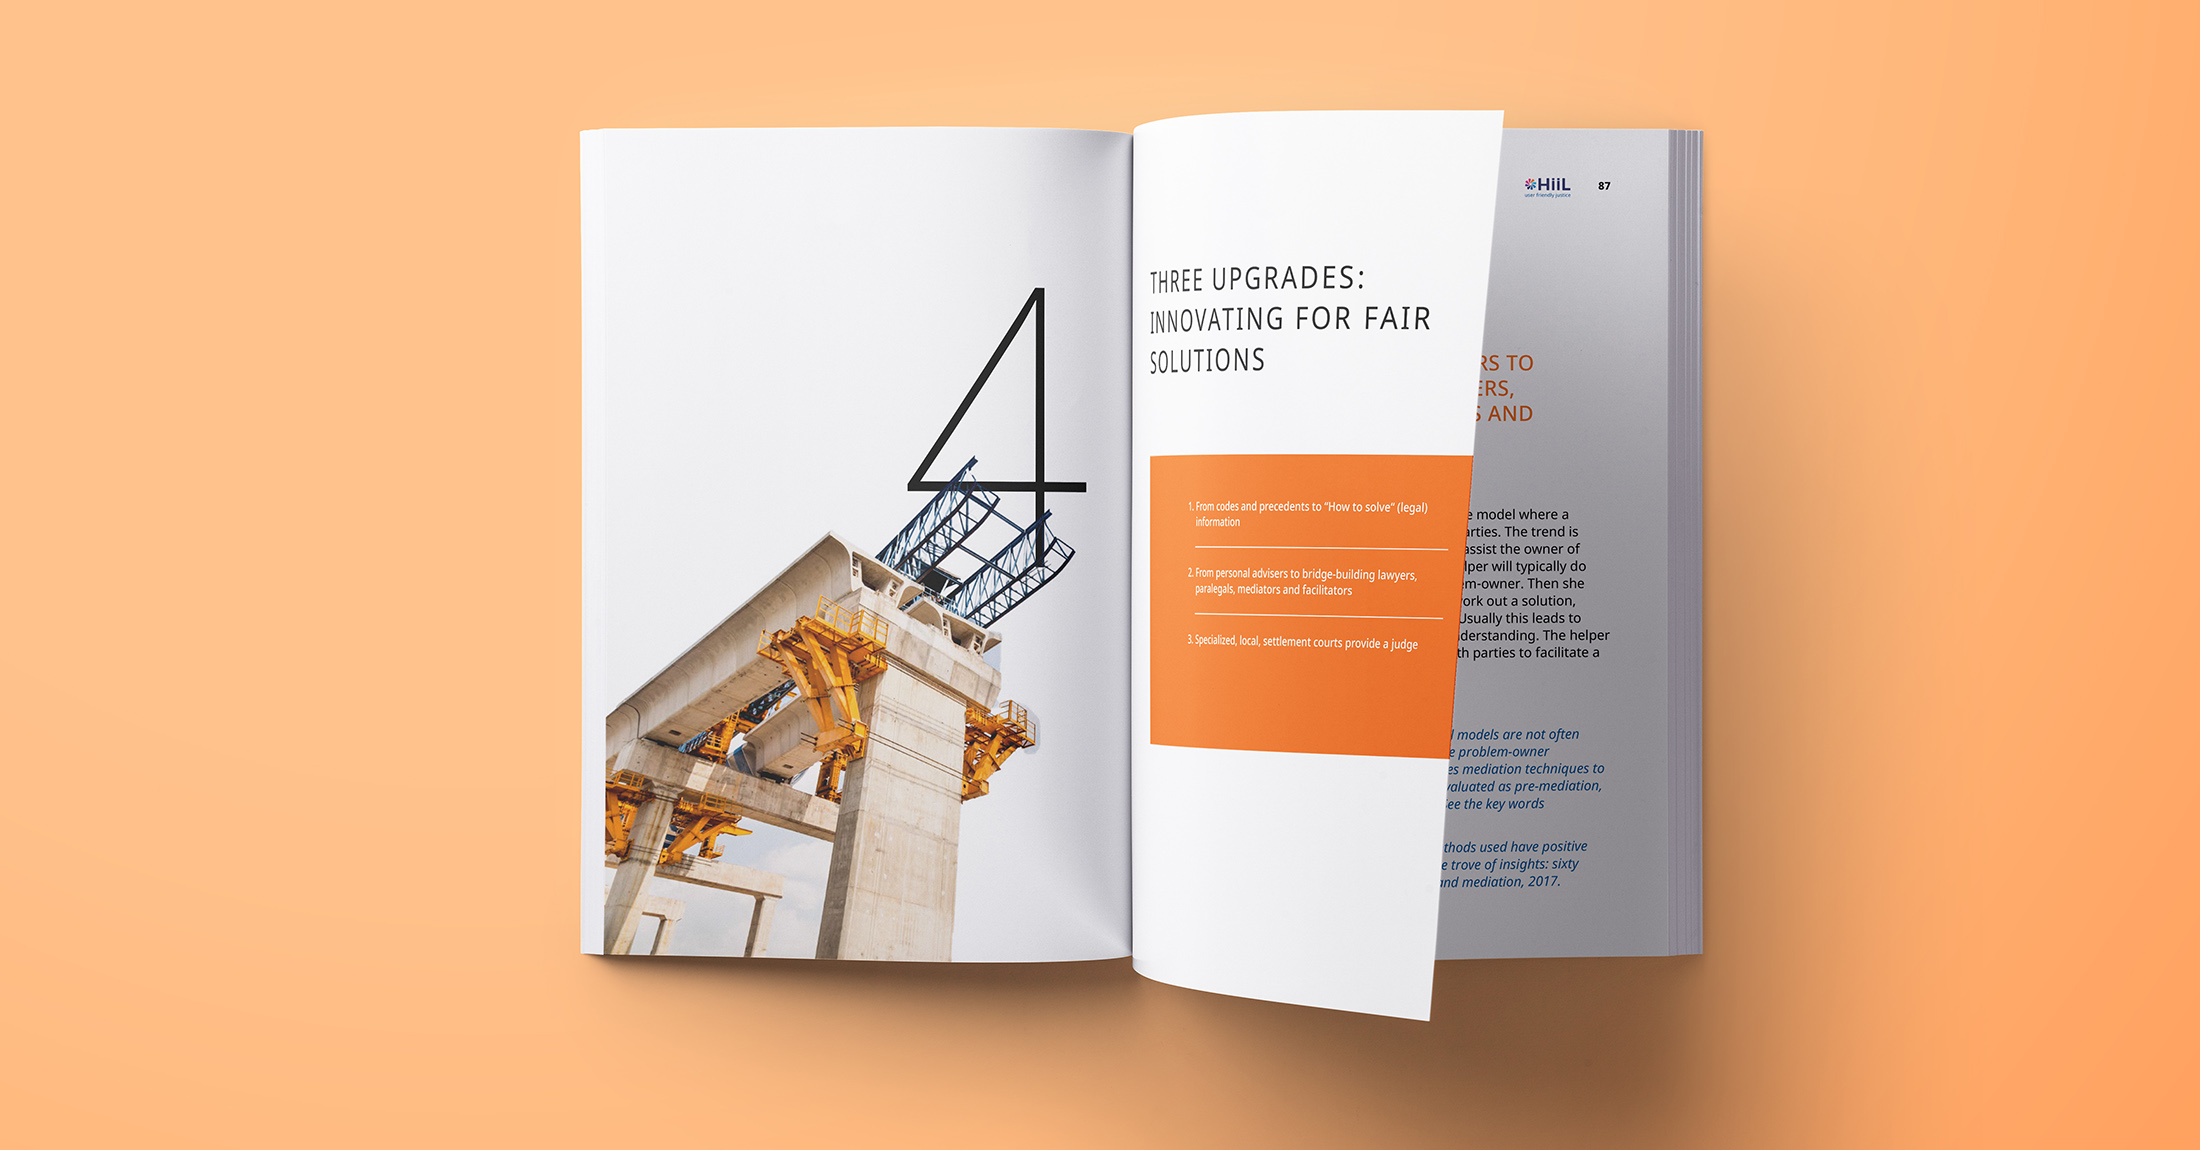
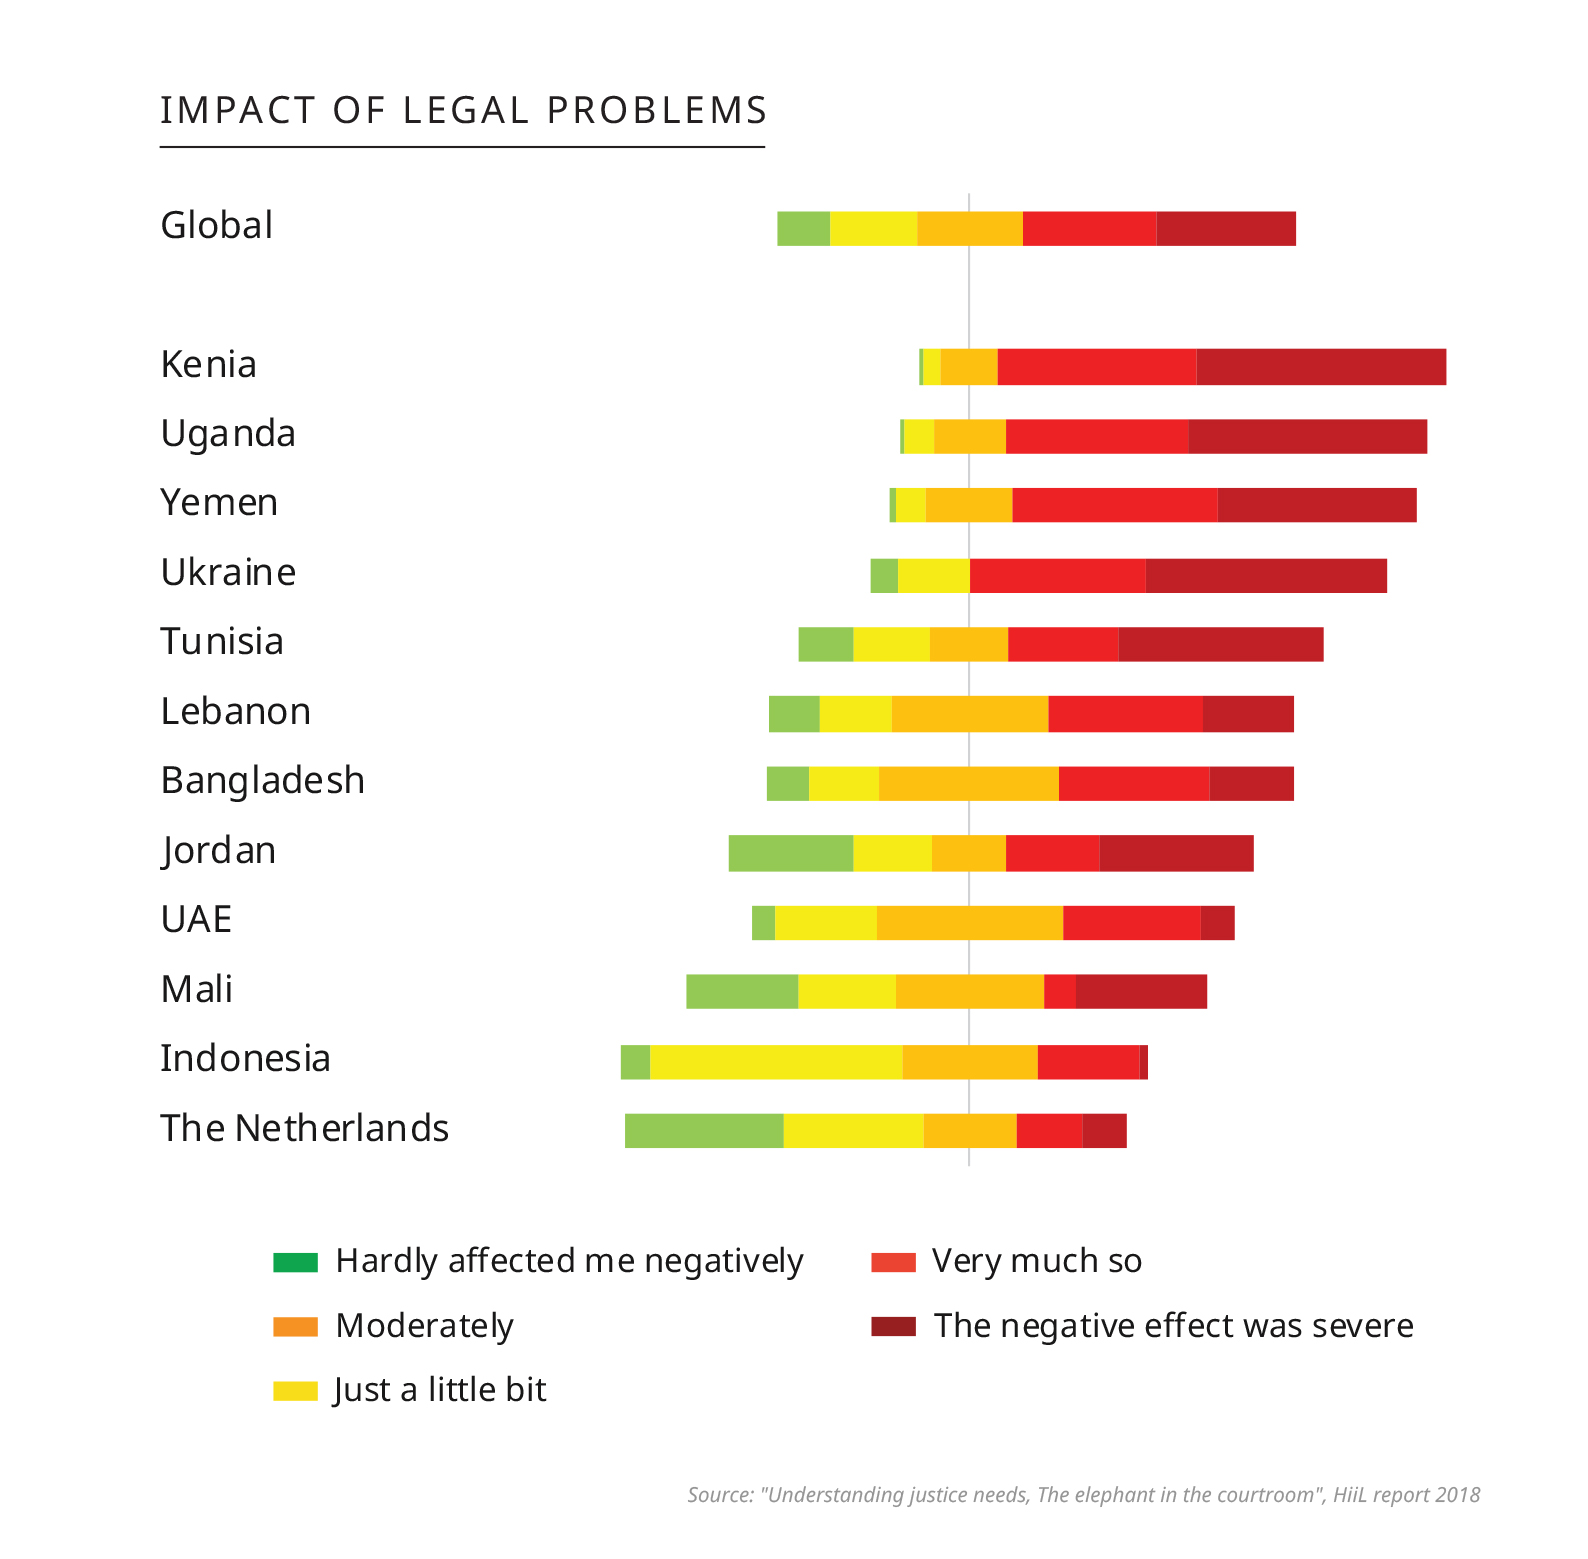
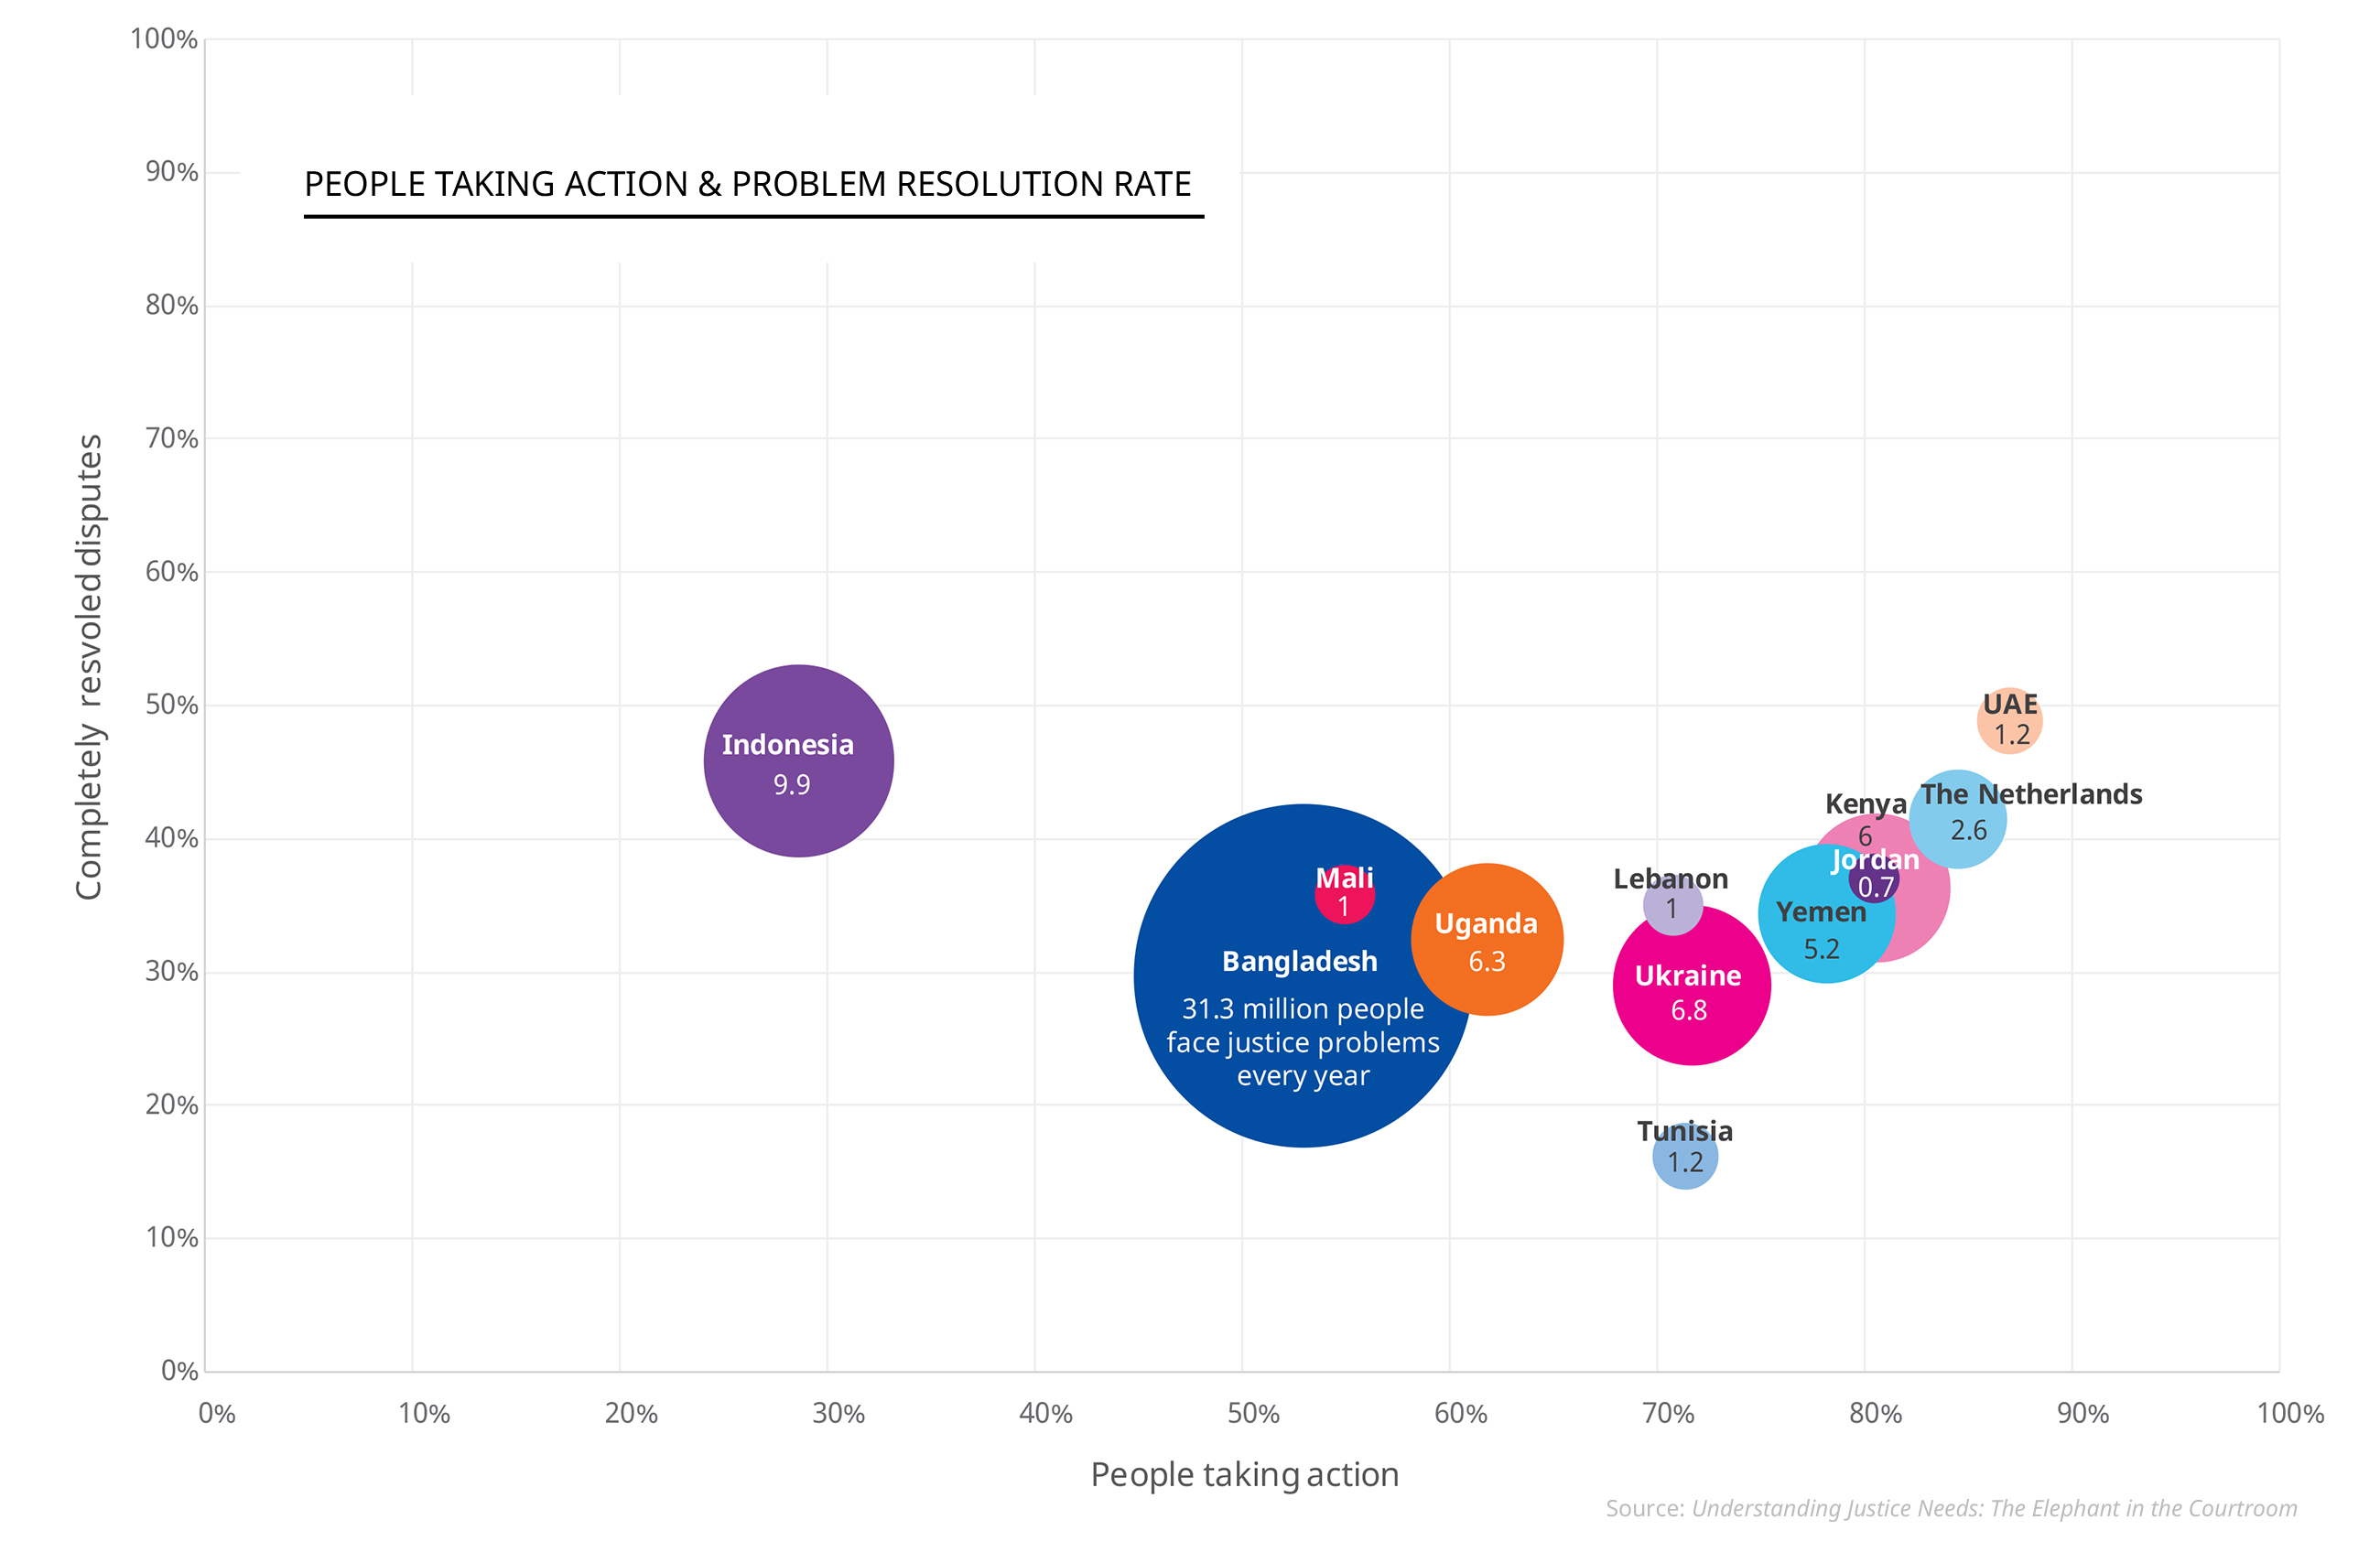
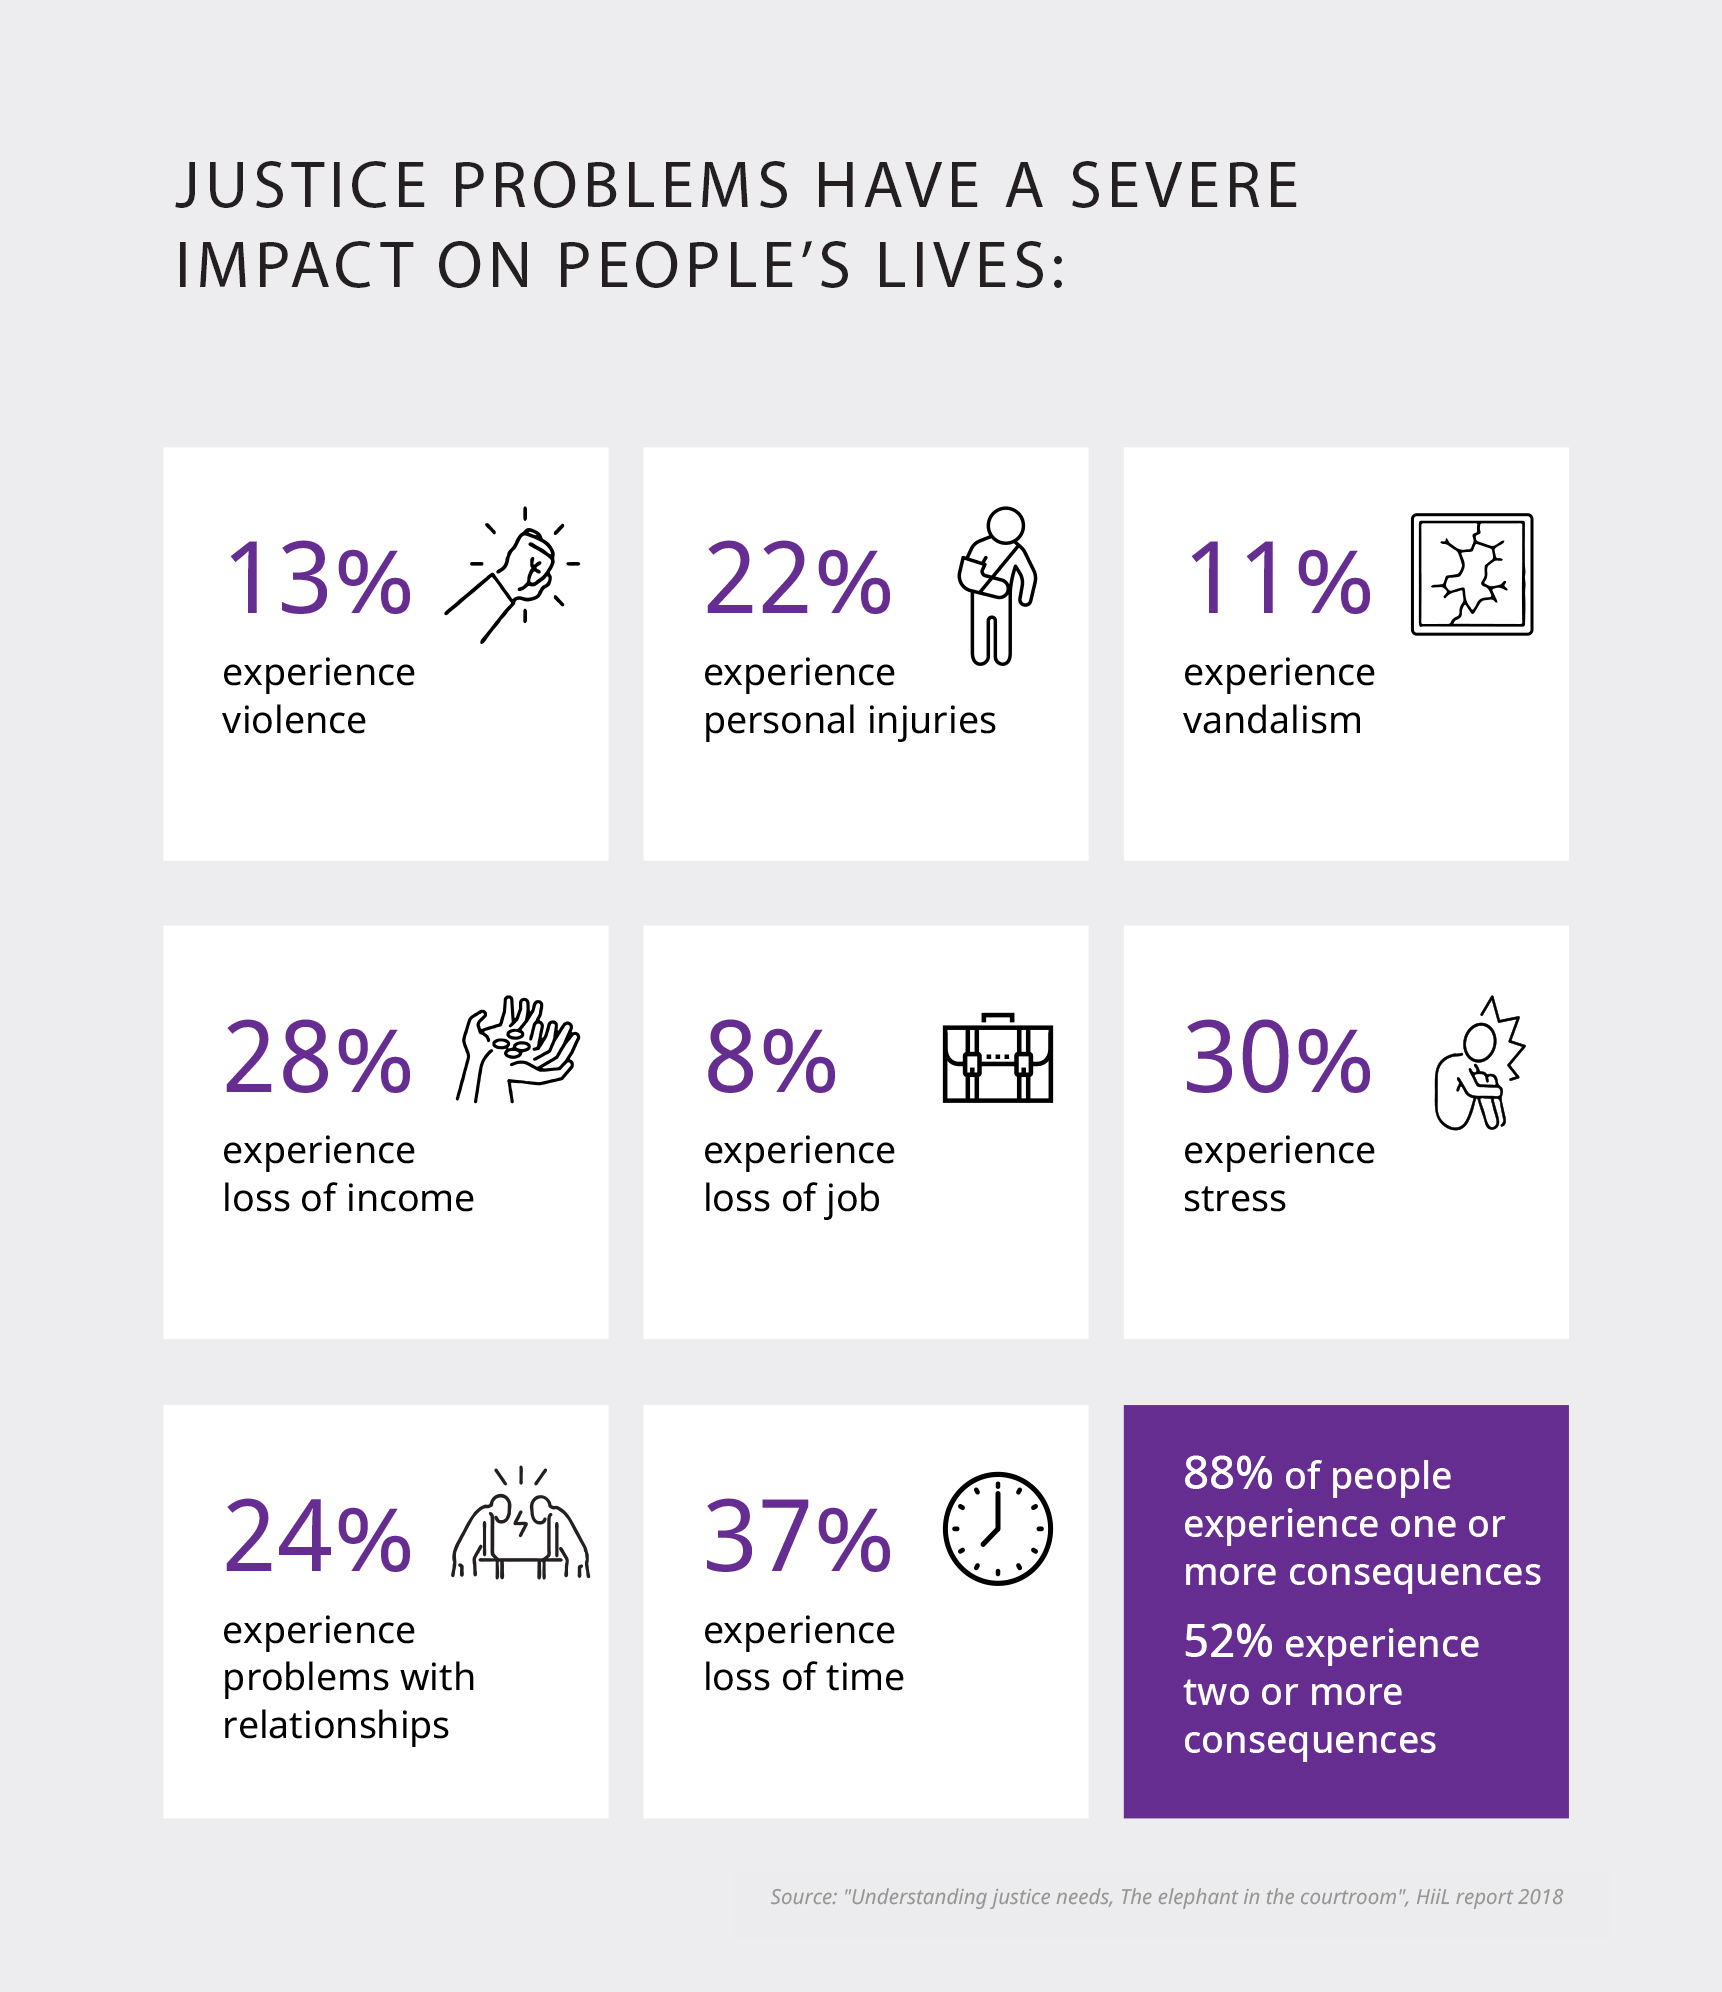
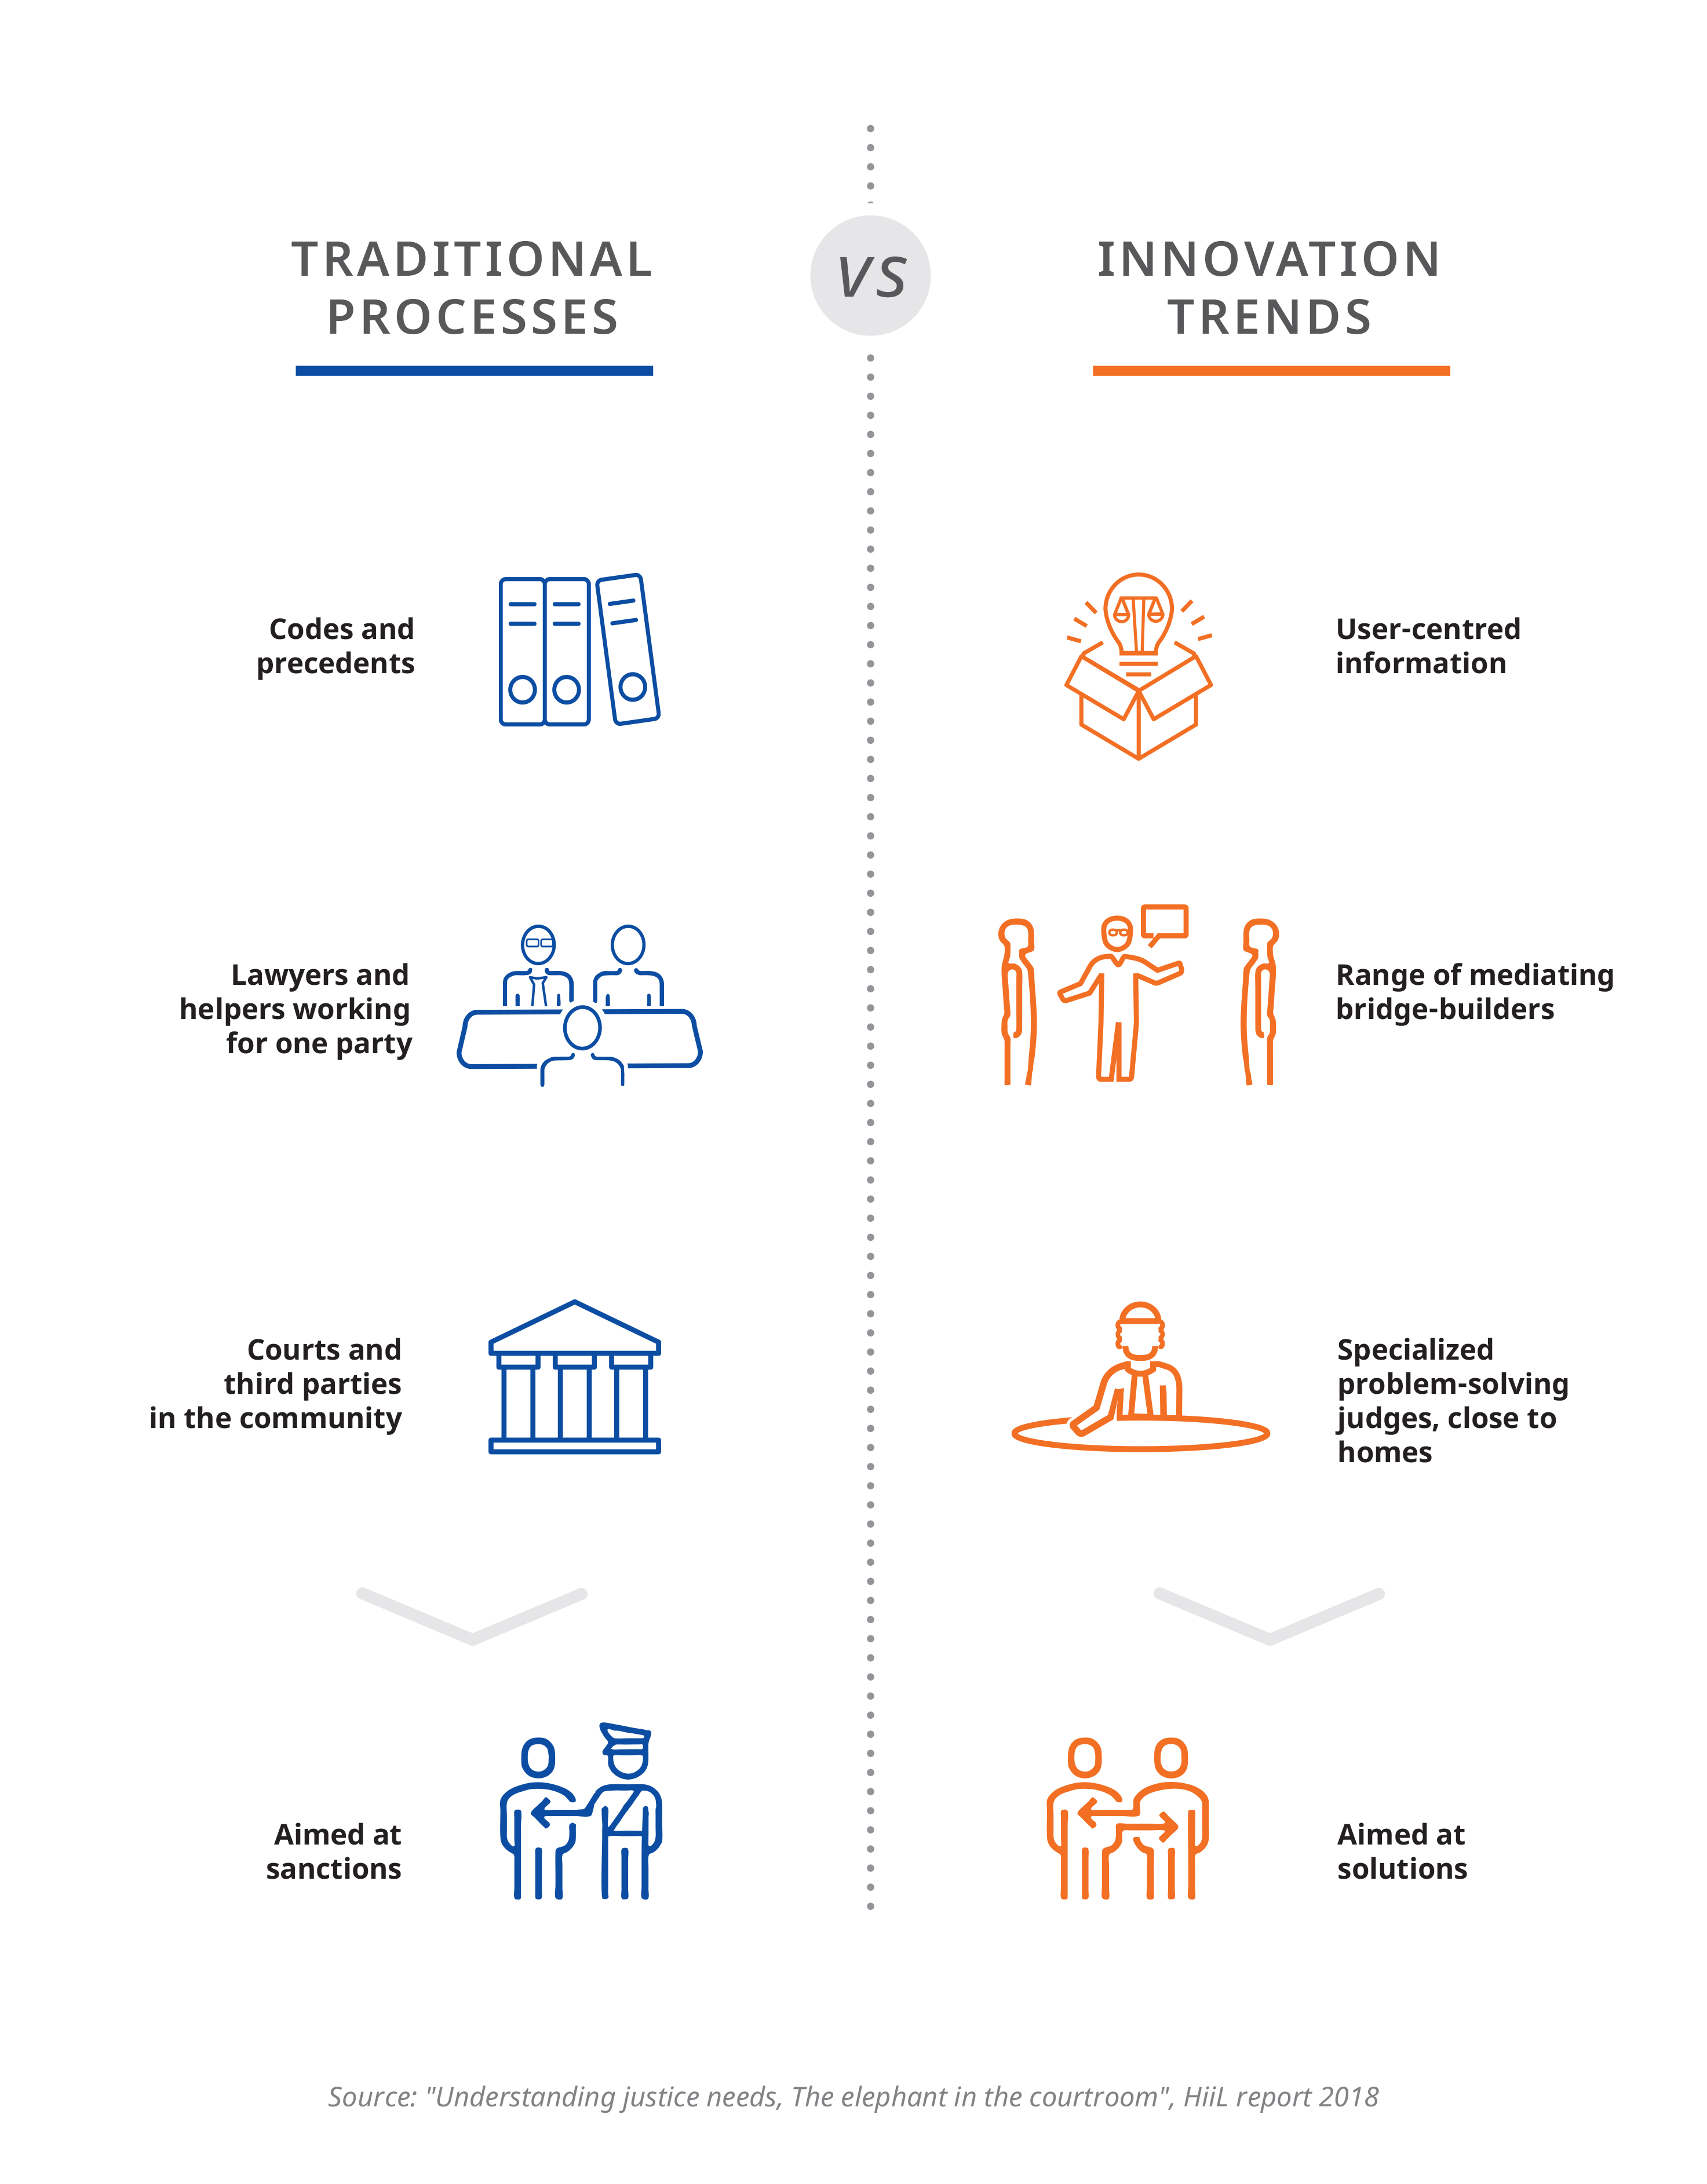
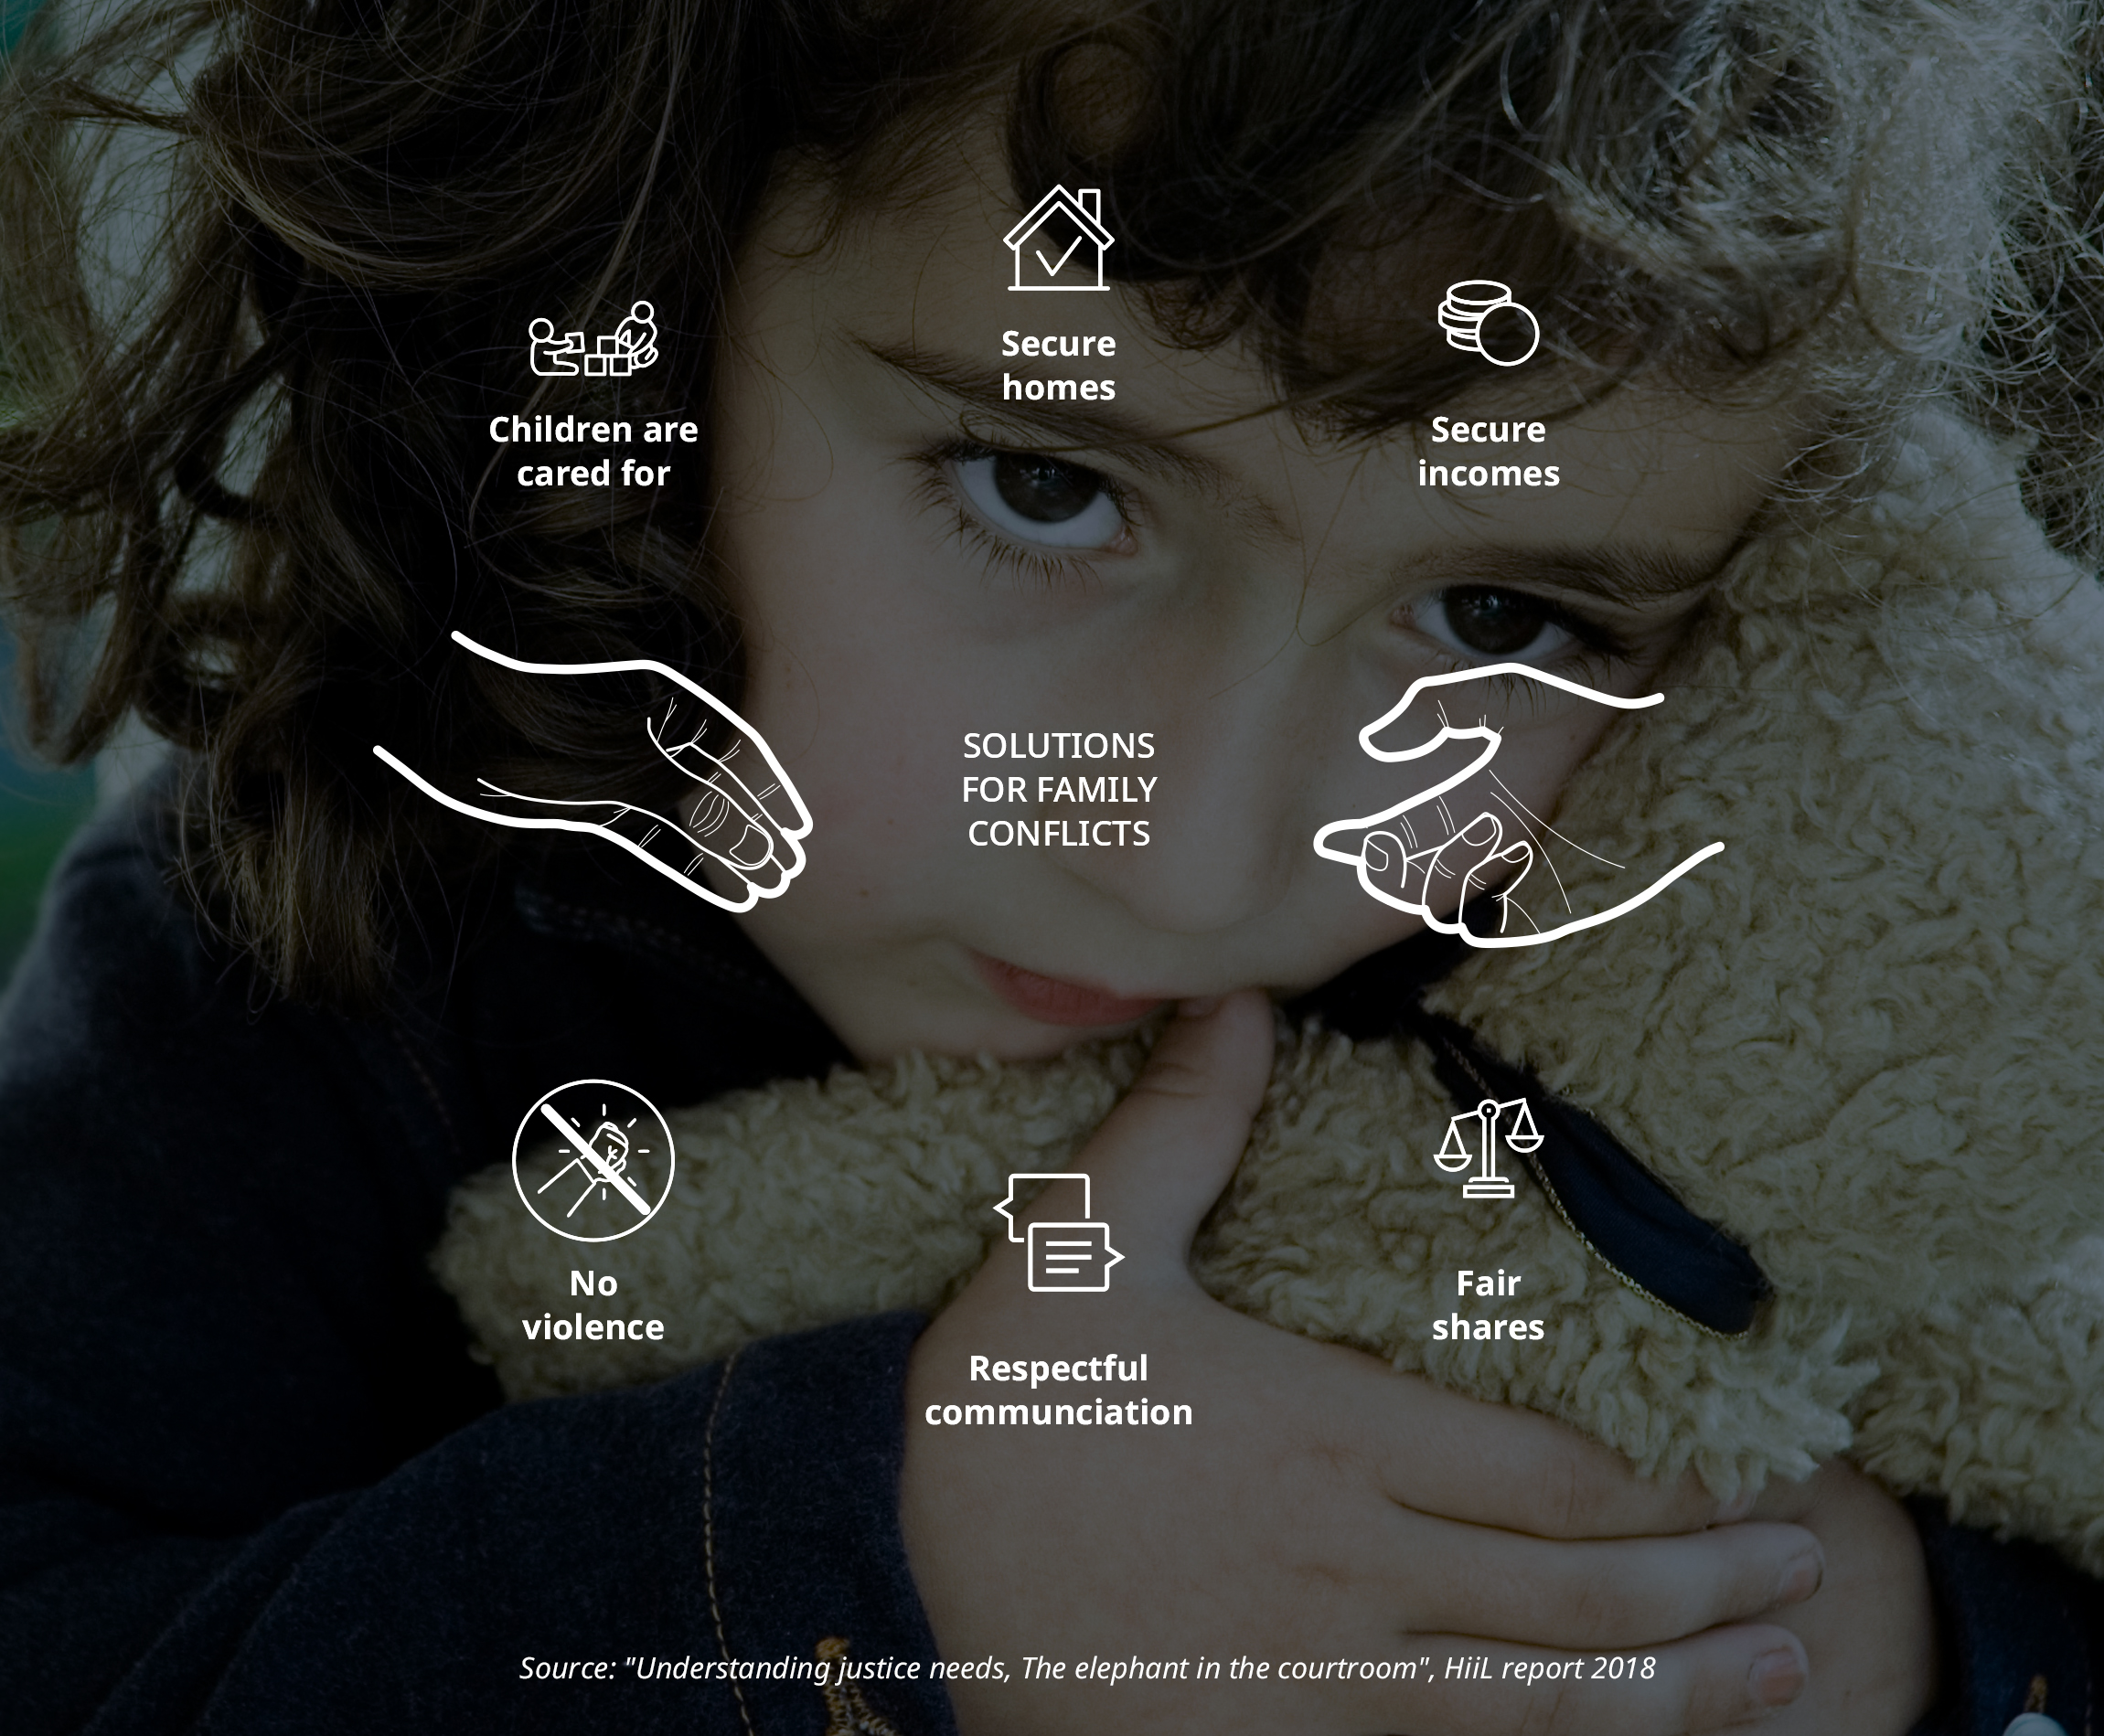
“Understanding Justice Needs: The Elephant in the Courtroom” is a trend report addressing the following questions, among others: what are the most serious legal problems of people around the world? do they get fair solutions? what are the barriers in the justice sector and how we can overcome them?
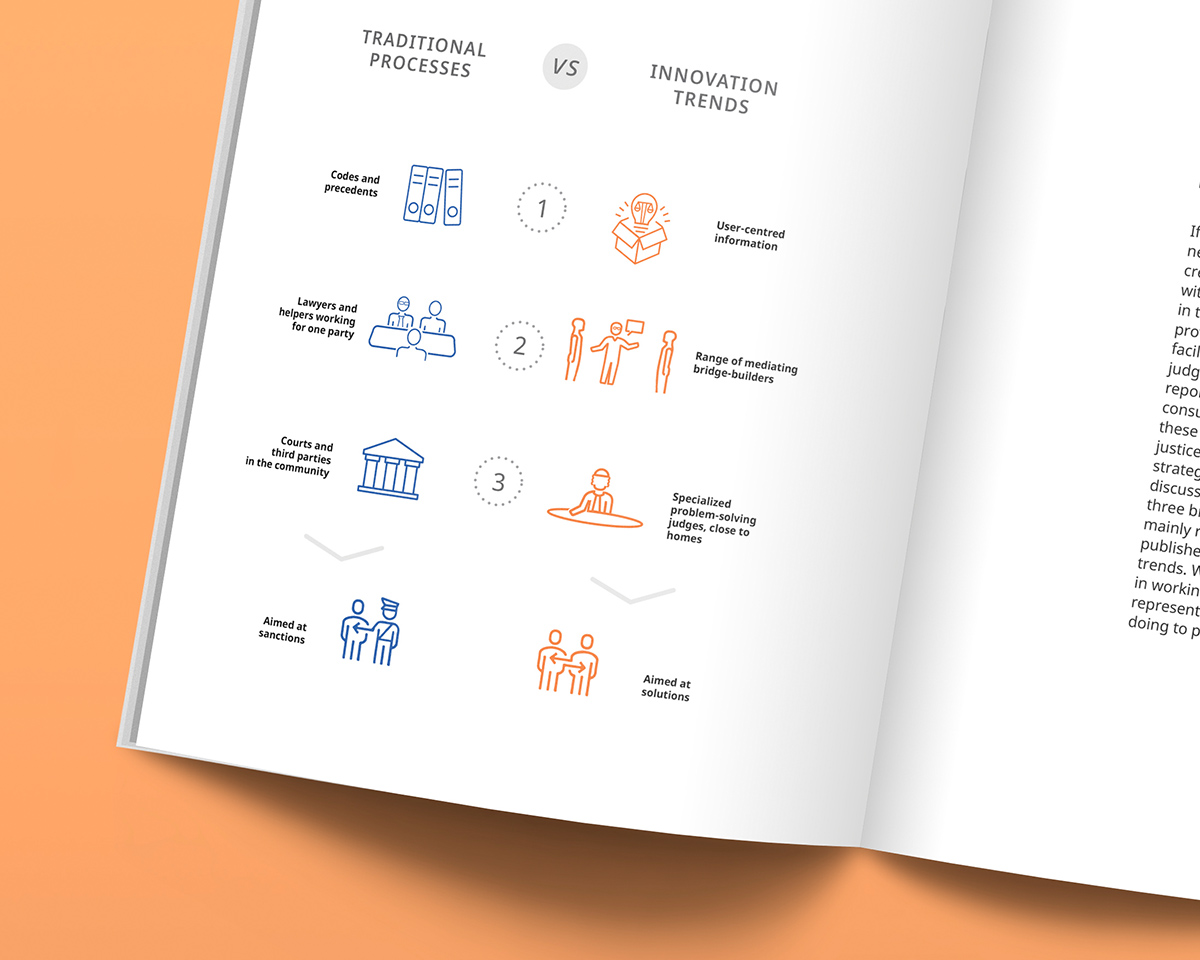
These issues are difficult. Very complex and hard to understand. The publication is full of quantitative data. Yet, the goal was to communicate these messages in an easy-to-digest way, in short paragraphs and with visualizations.
Prof. Dr. Maurits Barendrecht – lead author, consulting the design Tim Verheij – one of the co-authors, consulting the design Martijn Kind – one of the co-authors, consulting data visualization
All authors are listed at the end of the report.
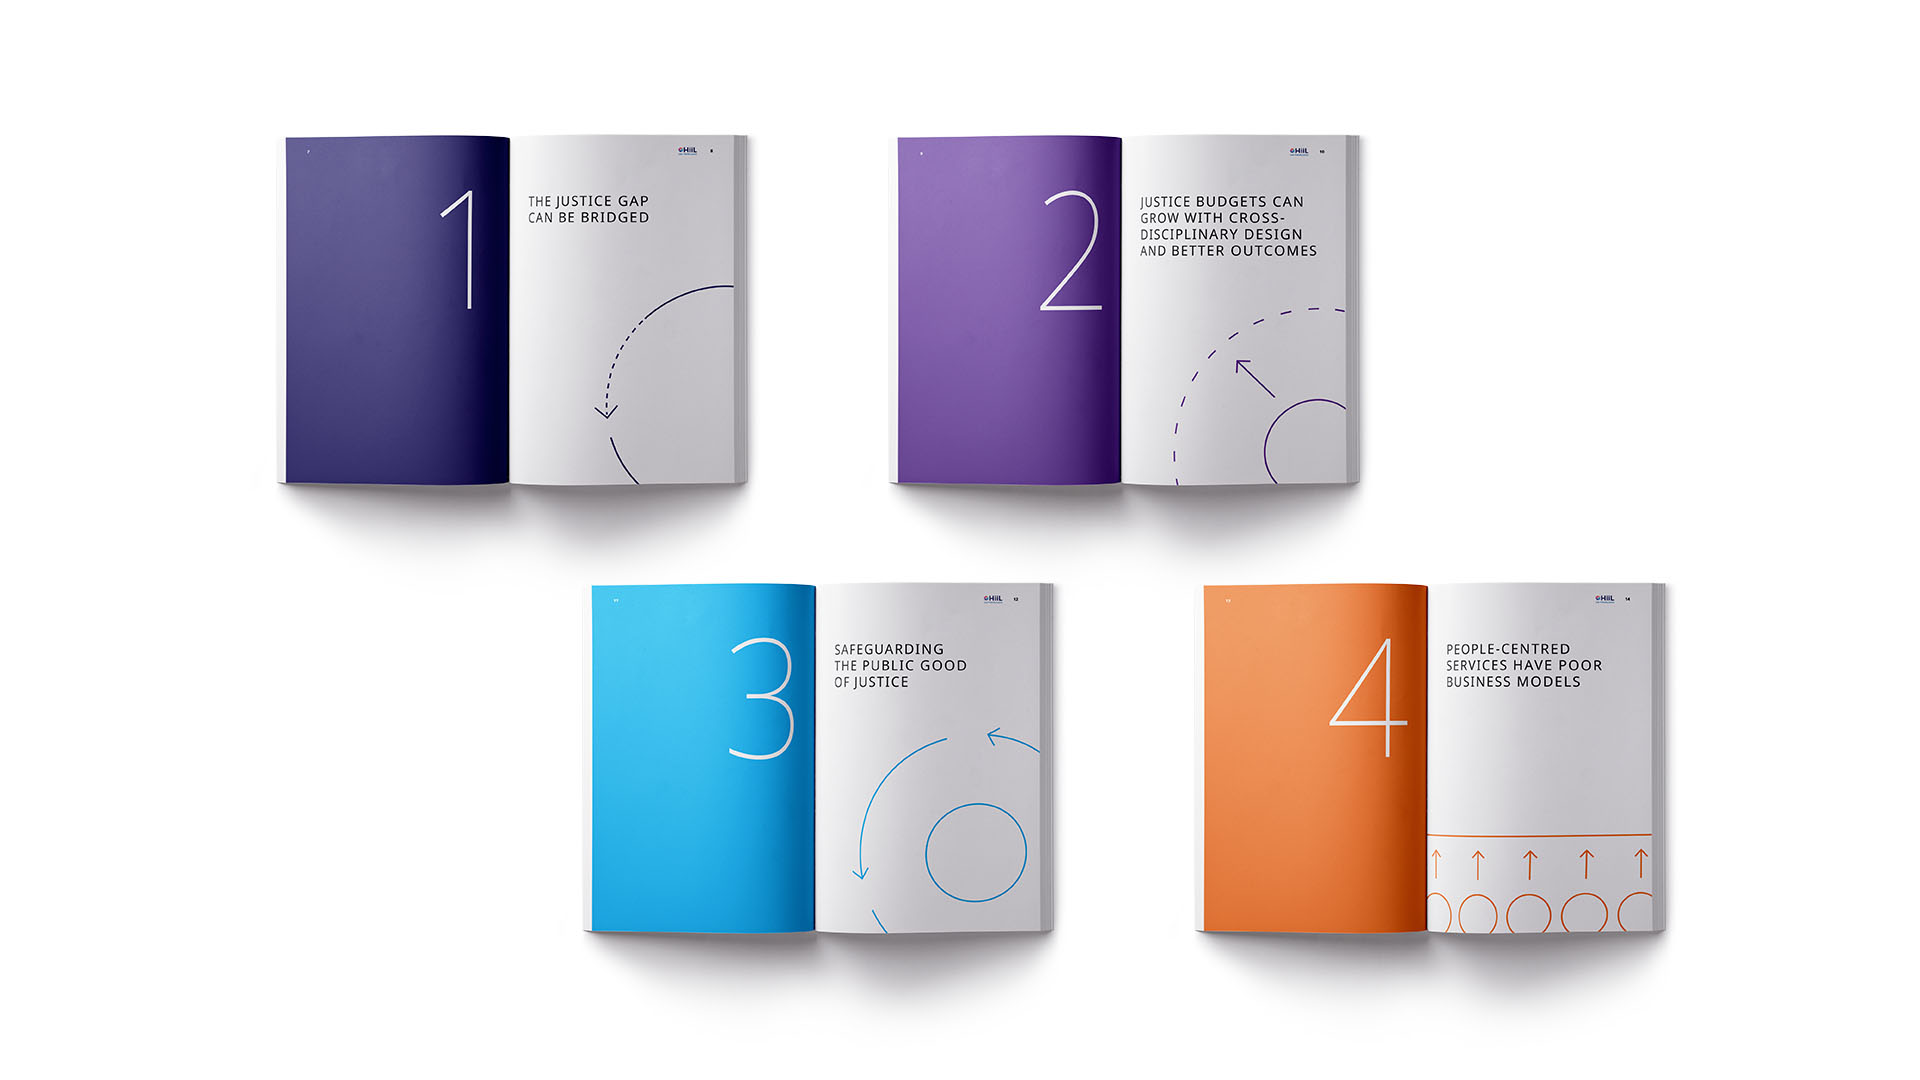
What makes the report easier to navigate?
Each chapter was colour-coded. Its title appeared in headings in a colour assigned for that chapter.
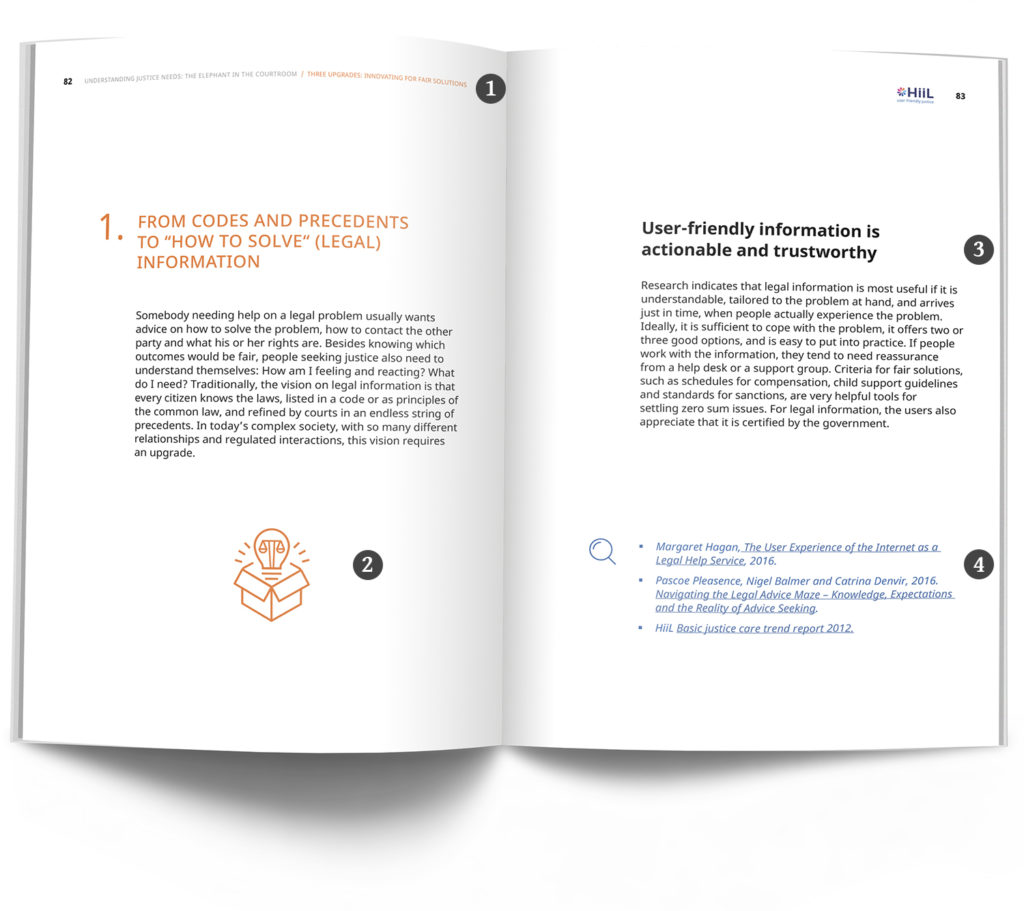
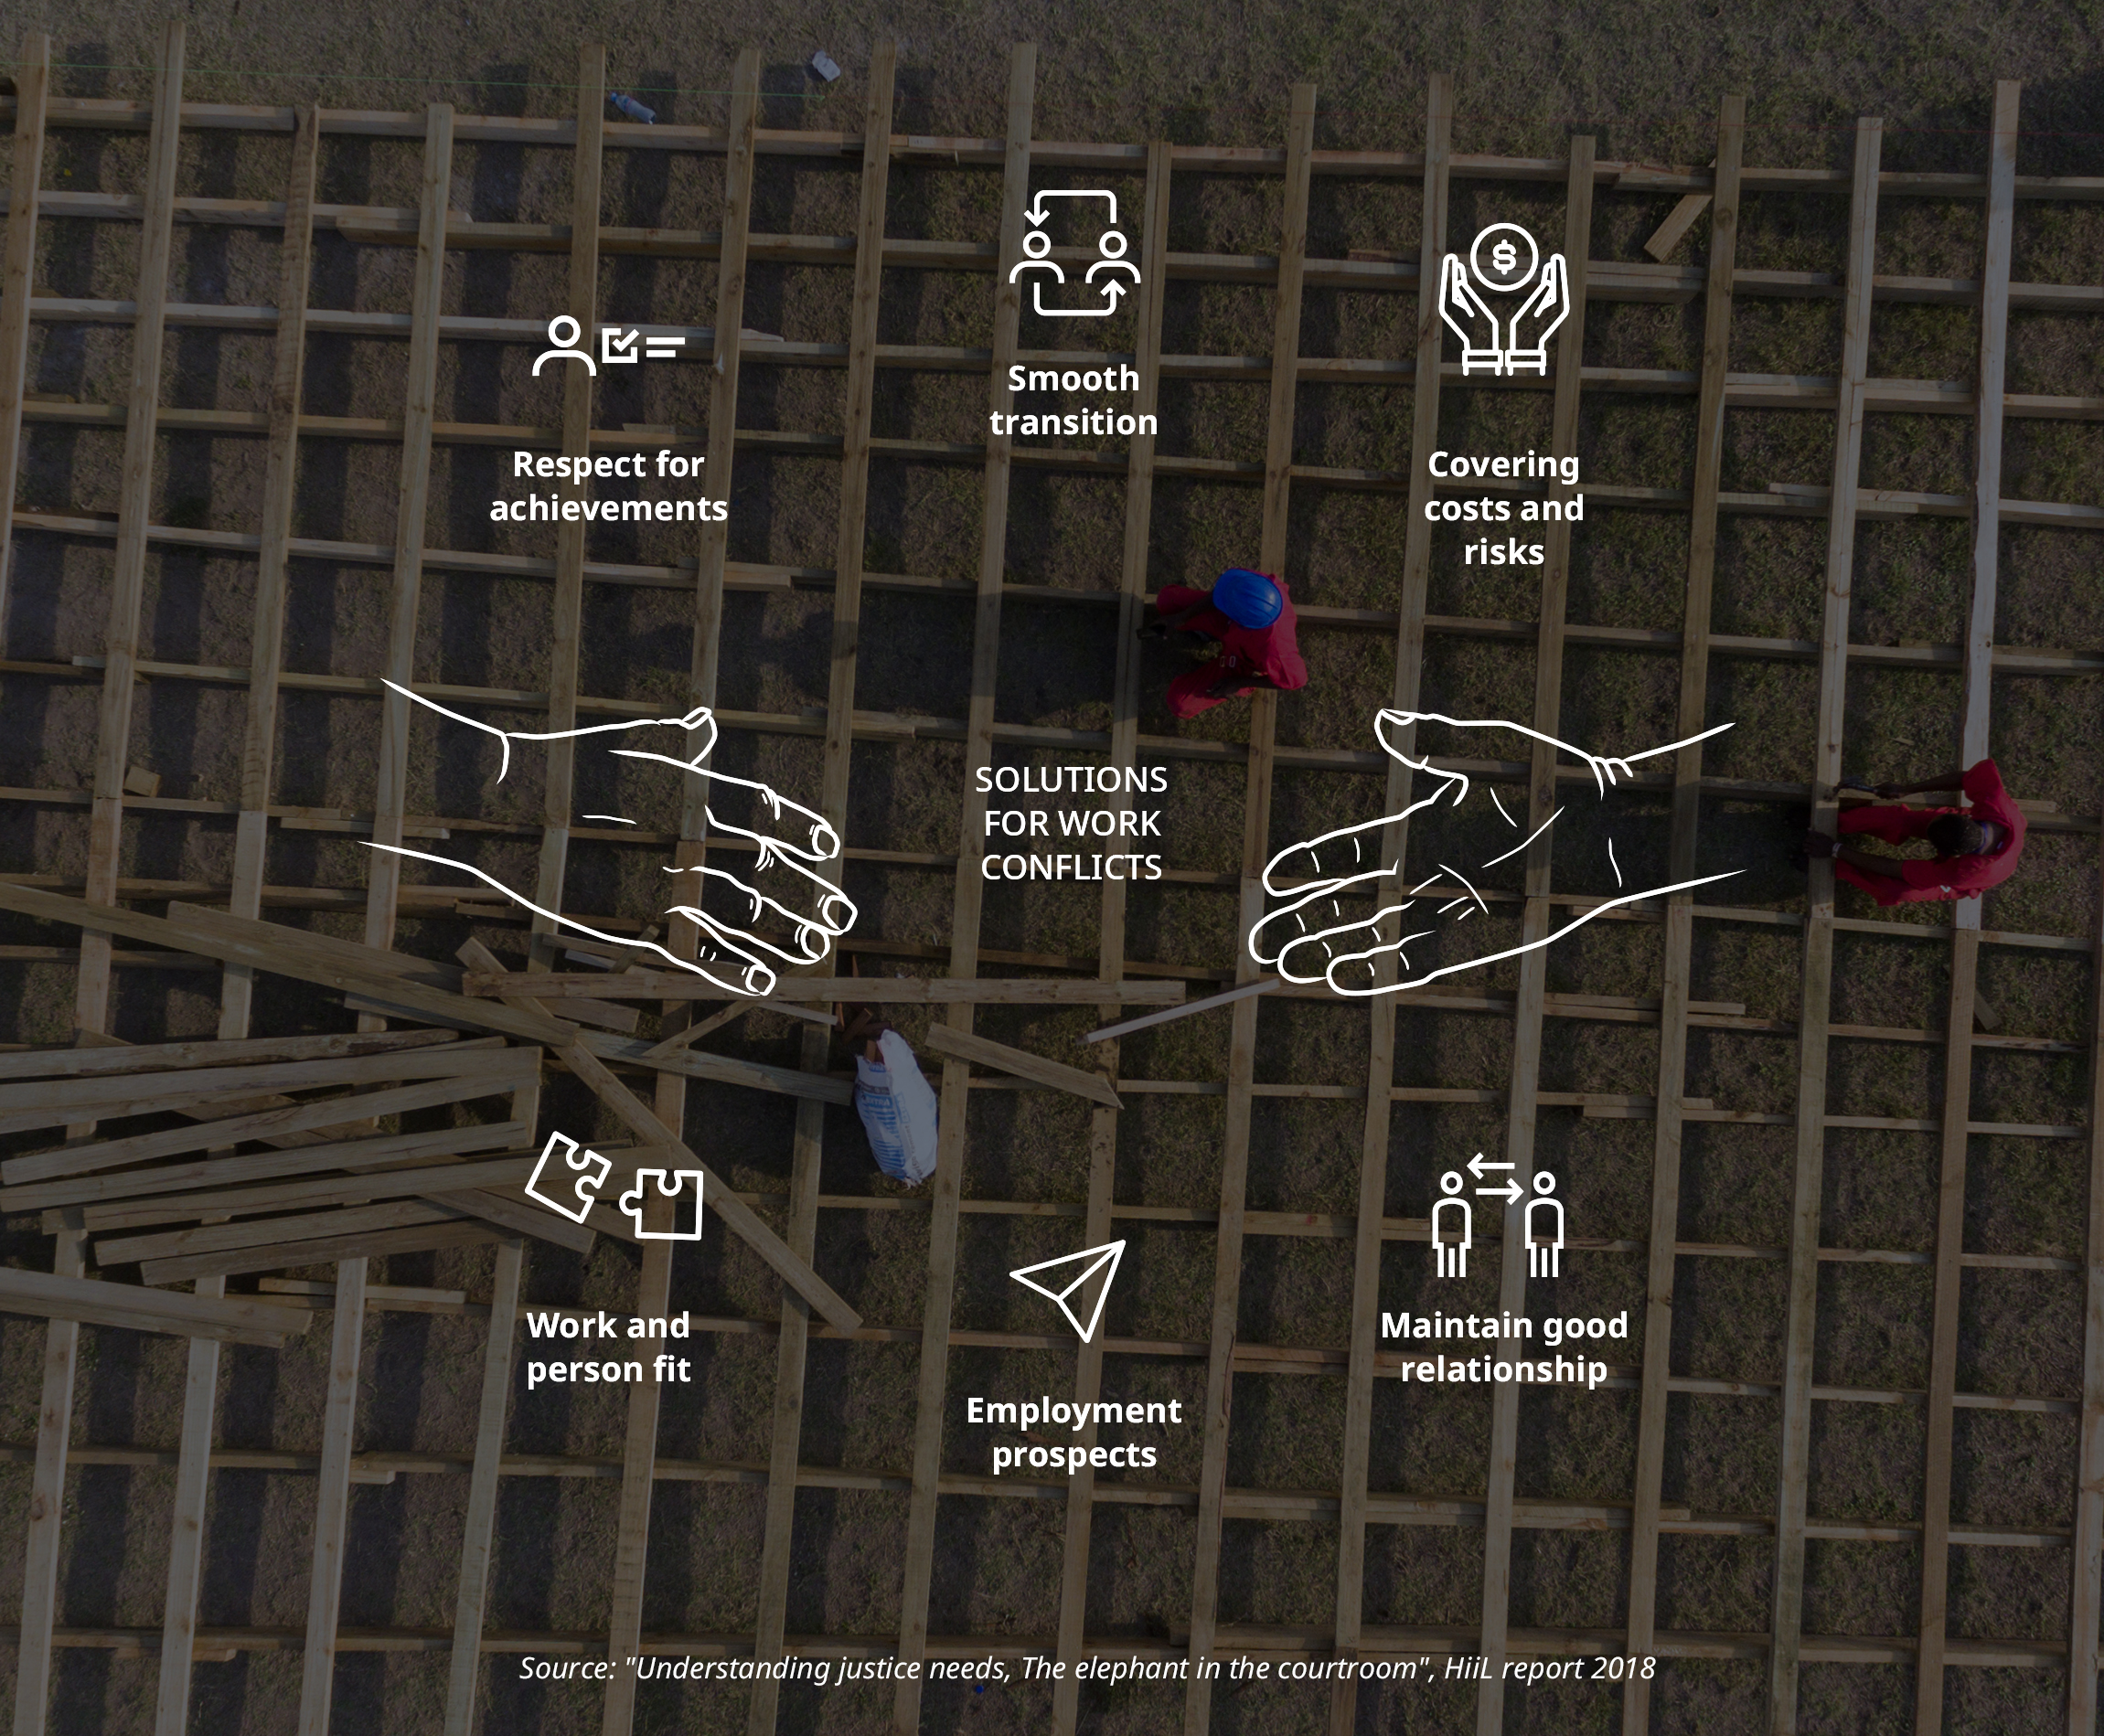
Icons referred to the infographic in the overview, creating additional cue for easy navigation.
Paragraphs were short, with clear headings, making the report easy to browse. The intention was to make the content easy to follow even without reading the whole publication from cover to cover.
References and hyperlinks always had the same accompanying icon and blue colour.
“Charging for Justice. SDG 16.3 Trend Report 2020” addressed a challenging topic: financing justice. I thought a lot about visualising the exchange that happens between institutions, stakeholders and people. Sometimes the return of investment is not monetary, but it’s about social impact. This is what I tried to convey in the cover design.
Prof. Dr. Maurits Barendrecht – lead author, consulting the design Isabella Banks – one of the co-authors, consulting the design and title pages
All authors are listed at the end of the report.
How to enhance understanding through illustrations
In the report you will find infographics showing the so-called access to justice gap and how to bridge it by financing different services. There is a table comparing the current state of justice services with the promising approaches – that one required a lot of simplification when designing. The whole designing process required collaboration with my colleagues and authors of the report.
Each title page in the report includes an illustration, which metaphorically explains the tension between services or parties involved.
This website uses cookies to improve your experience. We'll assume you're ok with this, but you can opt-out if you wish. Read MoreCookie settingsACCEPT
Privacy & Cookies Policy
Privacy Overview
This website uses cookies to improve your experience while you navigate through the website. Out of these cookies, the cookies that are categorized as necessary are stored on your browser as they are as essential for the working of basic functionalities of the website. We also use third-party cookies that help us analyze and understand how you use this website. These cookies will be stored in your browser only with your consent. You also have the option to opt-out of these cookies. But opting out of some of these cookies may have an effect on your browsing experience.
This website uses cookies to improve your experience while you navigate through the website. Out of these cookies, the cookies that are categorized as necessary are stored on your browser as they are as essential for the working of basic functionalities of the website. We also use third-party cookies that help us analyze and understand how you use this website. These cookies will be stored in your browser only with your consent. You also have the option to opt-out of these cookies. But opting out of some of these cookies may have an effect on your browsing experience.
Necessary cookies are absolutely essential for the website to function properly. This category only includes cookies that ensures basic functionalities and security features of the website. These cookies do not store any personal information.
Any cookies that may not be particularly necessary for the website to function and is used specifically to collect user personal data via analytics, ads, other embedded contents are termed as non-necessary cookies. It is mandatory to procure user consent prior to running these cookies on your website.